Dashboards
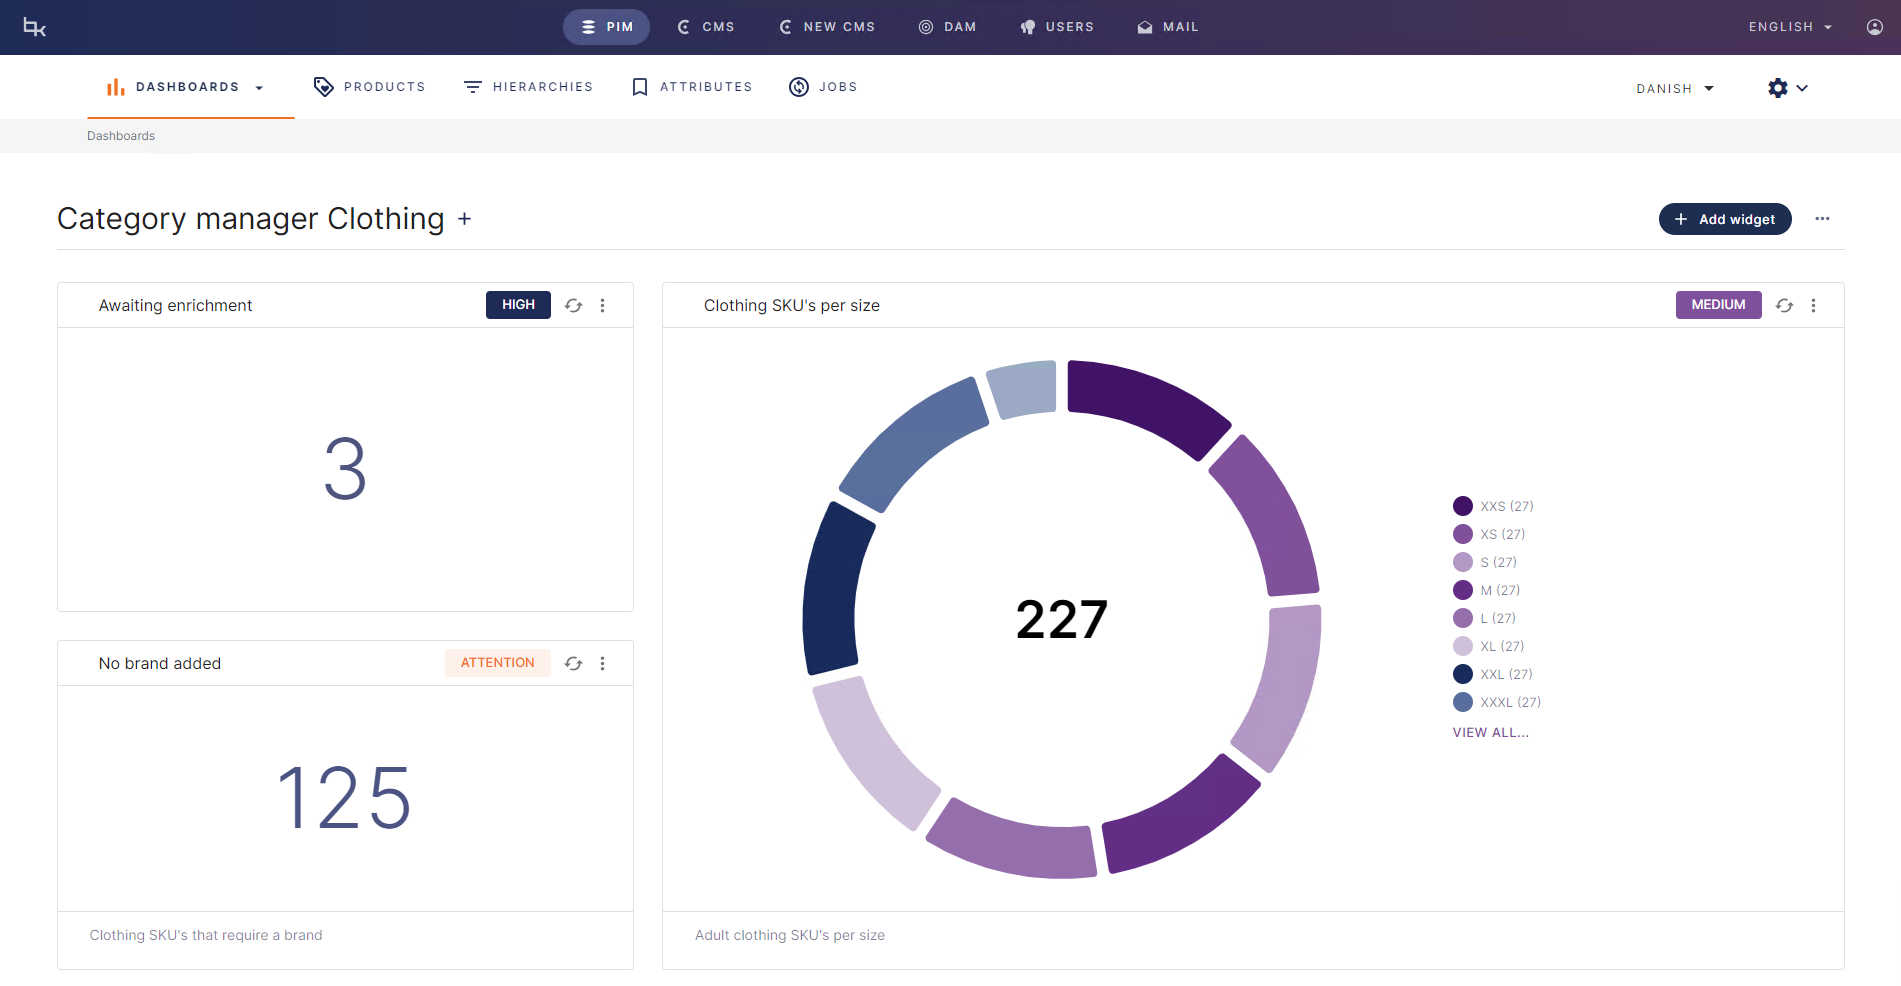
Dashboards in Bizzkit PIM are designed to give users a view on product data, which is relevant for their role or for a specific task they want to fulfill.
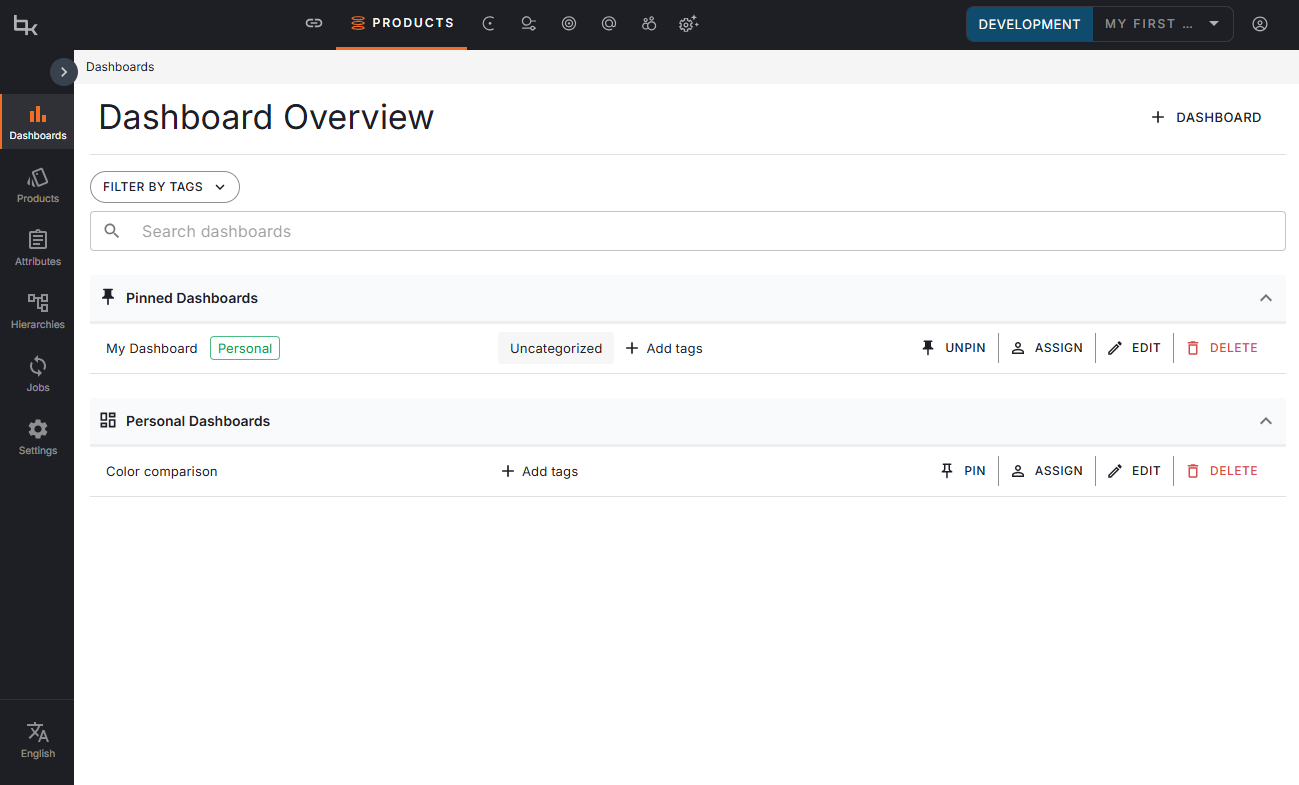
Dashboard overview
The dashboard overview shows all the dashboards a user has access to. This includes both dashboards created by the user as well as assigned dashboards, created by another user.
Each user with the Manage and Assign Dashboards permission is able to create dashboards for personal use, as well as assigning created dashboards to other users.
A dashboard is typically created with a specific user role or area of responsibility in mind, so it provides a focused view on a particular part of the PIM product catalog.
Dashboards are grouped into collapsible sections, described below. A section is only shown when it contains at least one dashboard. By default, dashboards within a section are sorted alphabetically by name, which makes them easy to find and identify. This default order changes when filtering by tags.
Each row in the overview shows the dashboard name, the tags assigned to it, and a set of actions:
PinandUnpinare available on every dashboard the user can see.Assignis available to the owner of the dashboard, and requires theManage and Assign Dashboardspermission.EditandDeleteare only available to the owner of the dashboard.
Pinned dashboards
Dashboards can be pinned by the user, which moves them to the Pinned Dashboards section at the top of the dashboard overview page. Pinning is personal, so it only affects the overview of the user who pinned the dashboard.
This section can hold both personal and assigned dashboards, so each row is marked with a Personal or an Assigned badge to show why the user has access to it.
Personal dashboards
The Personal Dashboards section shows dashboards created by the user themselves. The user is the owner of these dashboards and can edit, assign, and delete them.
Assigned dashboards
It's possible to share dashboards with other users, by assigning them to one or multiple users. The user who created the dashboard is the owner and will be able to edit or delete the dashboard, while the assigned users are able to use the dashboard without modifying it.
Dashboards that another user has assigned to the current user are shown in the Assigned Dashboards section.
Dashboard tags
Tags are free-form labels that can be assigned to a dashboard. They are used to group dashboards by theme, team, or area of responsibility, and to filter the dashboard overview down to the dashboards that are relevant right now.
A dashboard can have any number of tags, and the same tag can be used on any number of dashboards.
Note
Dashboard tags are not related to the Prioritization tag widget property. A dashboard tag labels a whole dashboard, while the prioritization tag applies to a single widget.
Dashboard tags behave as follows:
- Tags are shared across the installation. They are not personal. Once a tag exists on any dashboard, it is suggested to every user who edits a dashboard, and it can be used in the tag filter on the overview.
- Tag names are matched without regard to case. Typing
seowhen a tag namedSEOalready exists reuses the existing tag instead of creating a near-duplicate. - A tag name can be up to 200 characters long. Tag names are free text and may contain spaces.
- Tags cannot be renamed. To change the wording of a tag, remove it from every dashboard that uses it and add a tag with the new name instead.
- Tags are cleaned up automatically. A tag exists only for as long as at least one dashboard uses it. When the last dashboard using a tag drops it, or that dashboard is deleted, the tag disappears from the suggestions and from the tag filter. There is no separate screen for managing tags.
Changing the tags on a dashboard requires the Manage and Assign Dashboards permission, and can only be done by the owner of the dashboard. All users can see the tags and filter by them.
Adding tags to a dashboard
The same Tags field appears in two places:
- The
Create dashboarddialog, when creating a new dashboard. - The
Edit dashboarddialog, when editing an existing dashboard.
The Edit dashboard dialog can be opened in three ways, all of which are available to the owner of the dashboard only:
- The
Editaction on a dashboard row in the overview. - The
+ Add tagslink on a dashboard row, which is a shortcut to the same dialog. - The
...menu on the dashboard itself, followed byEdit.
In the Tags field, start typing to narrow the list of existing tags, then select a tag to apply it. To create a new tag, type the full name and confirm it with Enter, or by typing a comma.
Saving replaces the full set of tags on the dashboard, so removing a tag from the field also removes it from the dashboard.
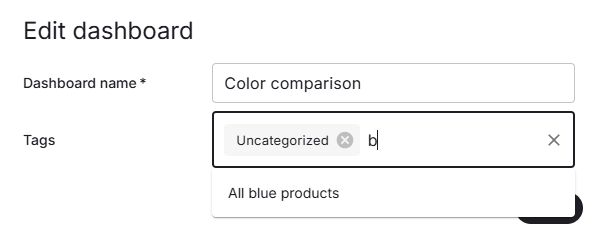
The tags on a dashboard are shown as labels on its row in the dashboard overview. They are not shown on the dashboard itself.
Tip
Read about adding tags to a dashboard in the how-to article.
Finding dashboards
As the number of dashboards grows, the dashboard overview offers two ways to narrow the list: a search field and a tag filter. Both remain visible above the dashboard sections while the list is scrolled.
The two can be combined. When a search term and one or more tags are active at the same time, only the dashboards that satisfy both are shown.
Searching by name
The Search dashboards field narrows the overview to dashboards whose name contains the text that is typed. The match is not case-sensitive, and it matches anywhere in the name, so searching for season also finds Autumn season 2026.
The results update as the user types. The dashboard sections are kept, so the results stay grouped as pinned, personal, and assigned dashboards, and a section is hidden when none of its dashboards match.
The search covers dashboard names only. It does not search tags, widget titles, or the product data shown in the widgets. To narrow the list by tag, use the tag filter instead.
When no dashboard matches, the overview shows an empty state in place of the dashboard sections. The search field and any selected tags remain in place, so the search can be adjusted or cleared again.
Filtering by tags
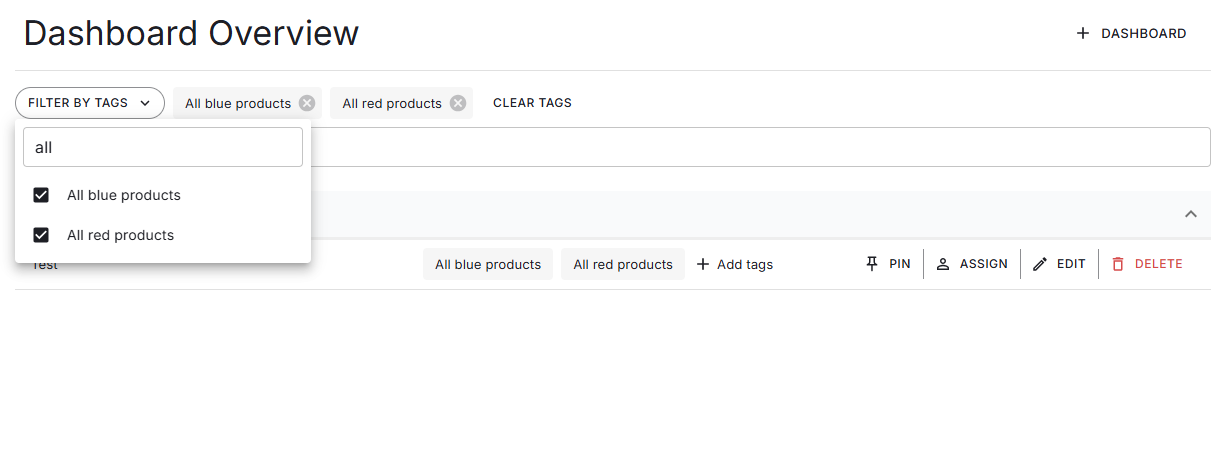
The Filter by tags button opens a list of all tags that are currently in use, in alphabetical order. Selecting a tag filters the overview immediately, and any number of tags can be selected at the same time.
Each selected tag is shown next to the button and can be removed on its own, or all selected tags can be removed at once with Clear tags.
A dashboard is shown if it has any of the selected tags, and not necessarily all of them. Dashboards that match more of the selected tags are shown first within their section.
Note
The list shows up to 50 tags at a time. In installations with many tags, use the Search tags field at the top of the list to find a specific tag.
Tip
Read about finding a dashboard in the how-to article.
Widgets
Each dashboard can contain a number of widgets, which give a view on product data. There's no limit for the amount of widgets that can be added to a dashboard.
Types of widgets
There are five different types of widgets that can be used, when creating or modifying a dashboard in Bizzkit PIM:
- Statistics
- Donut chart
- Bar chart
- List
- Trend line chart
Each widget type offers its own view on product data, with one or multiple data points.
The first four widget types show the state of product data right now, based on data sets. The trend line chart is different: it shows how product data has changed over time, based on trend filters.
Widget properties
The following general properties are available for all widget types:
- Type
- Title
- Prioritization tag
- Description
- Width
- Height
- Data sets
Data sets
Widget data sets are the data input for a widget. Depending on the type of widget, either one or multiple data sets can be configured.
A single data set consists of a reference to an existing product filter, as well as a label. The referenced product filter is used to show the actual widget data, while the label is used to describe the meaning of the data set in the widget.

Creating or editing filters directly from widget
Data sets can be applied to a widget by either selecting a saved filter, or by creating a filter on the fly directly from the widget configuration. The big benefit of setting a filter as data set directly from the widget, is that the user can see the result of the filter while setting it. This gives a good idea of the data which eventually will be shown in the dashboard widget.

Redirecting to the referenced product filter
Users can quickly access the product catalogue page with a specific data set's product filter applied. This is done by interacting with the widget, which redirects to the product catalogue page.
Widget-specific actions for opening the data set filter:
- Statistics: Click the numerical value to open the associated filter.
- Donut chart: Click a donut segment or its legend label to open the corresponding filter.
- Bar chart: Click a bar segment or its label to open the corresponding filter.
- List: Click 'Open List' to open the associated filter for that list.
This functionality allows users to seamlessly transition from dashboard insights to detailed product data views.
Trend line chart
The trend line chart widget is different from the other widget types: rather than showing the current state of product data, it visualises how a product count has changed over time. It is configured with trend filters instead of data sets.
See Trends for a full description of trend filters and the trend line chart widget.